Trocco's product architecture is developed to suit the practical needs of professional data engineers. Designed to take into account not only transfer speeds and connector count, but also reliability, scalability and security.
In today’s competitive gaming landscape, understanding how players interact with your game is critical. From retention to monetization, analyzing player behavior can offer insights that influence product direction and improve business outcomes. However, collecting and making sense of gameplay data presents challenges. Player data is often spread across systems like MySQL, MongoDB, and SDKs such as Firebase or Unity. It tends to be raw, inconsistent, and high-volume. In this blog I explore how modern data platforms and data integration tools—such as Databricks and TROCCO—can support end-to-end gaming analytics workflows that enable better decision-making.
What is Player Behavior Analysis?
Simply put, player behavior analysis involves tracking and interpreting how users engage with a game. Some key areas we can measure include:
Churn Analysis
Player Retention Analysis
Player User Analysis (Most Engaged Users)
In-Game Purchase Behavior
Region and Device Segmentation
What are some of the value outcomes and why does this matter? Behavioral analysis can be very useful to game studios in ways such as:
Improving retention by identifying disengagement early, then triggering re-engagement campaigns through email or in-app notifications
Segmenting users based on engagement or play style, and tailor content or promotional offers accordingly
Optimizing game design and difficulty curves based on actual progression and drop-off patterns
Inform monetization strategies through LTV insights and offer targeted discounts or rewards to high-spending or at-risk players
Where Does the Data Come From?
Some common data sources in a gaming environment include:
Relational databases such as MySQL or PostgreSQL for user profiles and transaction data
NoSQL databases such as MongoDB for raw gameplay event logs
Game SDKs and backend tools, such as Unity and Firebase, that are used for real-time telemetry.
Example Pipeline
One way to effectively work with this data is first by ingesting it into a cloud data platform such as Databricks, which is used by many successful gaming companies such as Riot and Krafton. In this example, for simplicity's sake we will work with dummy data stored in MySQL as our data source. The process flow will be the following:
Extract raw data from MySQL and loading it into Databricks' Delta Lake using TROCCO
Transform the data using SQL in Databricks Notebooks, to clean and prepare it for analysis
Build dashboard visualizations in Databricks
Orchestrate and schedule the entire pipeline using TROCCO’s Workflow feature
Let's get started.
Step 1: Extracting and loading the data
The first step is to replicate the tables in our source database (MySQL), into Databricks. There are several ways we can achieve this, such as through custom scripts, open source tools, or managed data integration solutions. In this example, for ease of use, we will use our cloud ETL tool TROCCO. In TROCCO we can achieve this using the “Managed ETL” feature, allowing us to extract multiple tables from the source, in one job setting.
After selecting the appropriate credentials and entering some basic information about the data source and the destination, the next step is to select which tables we want to replicate.
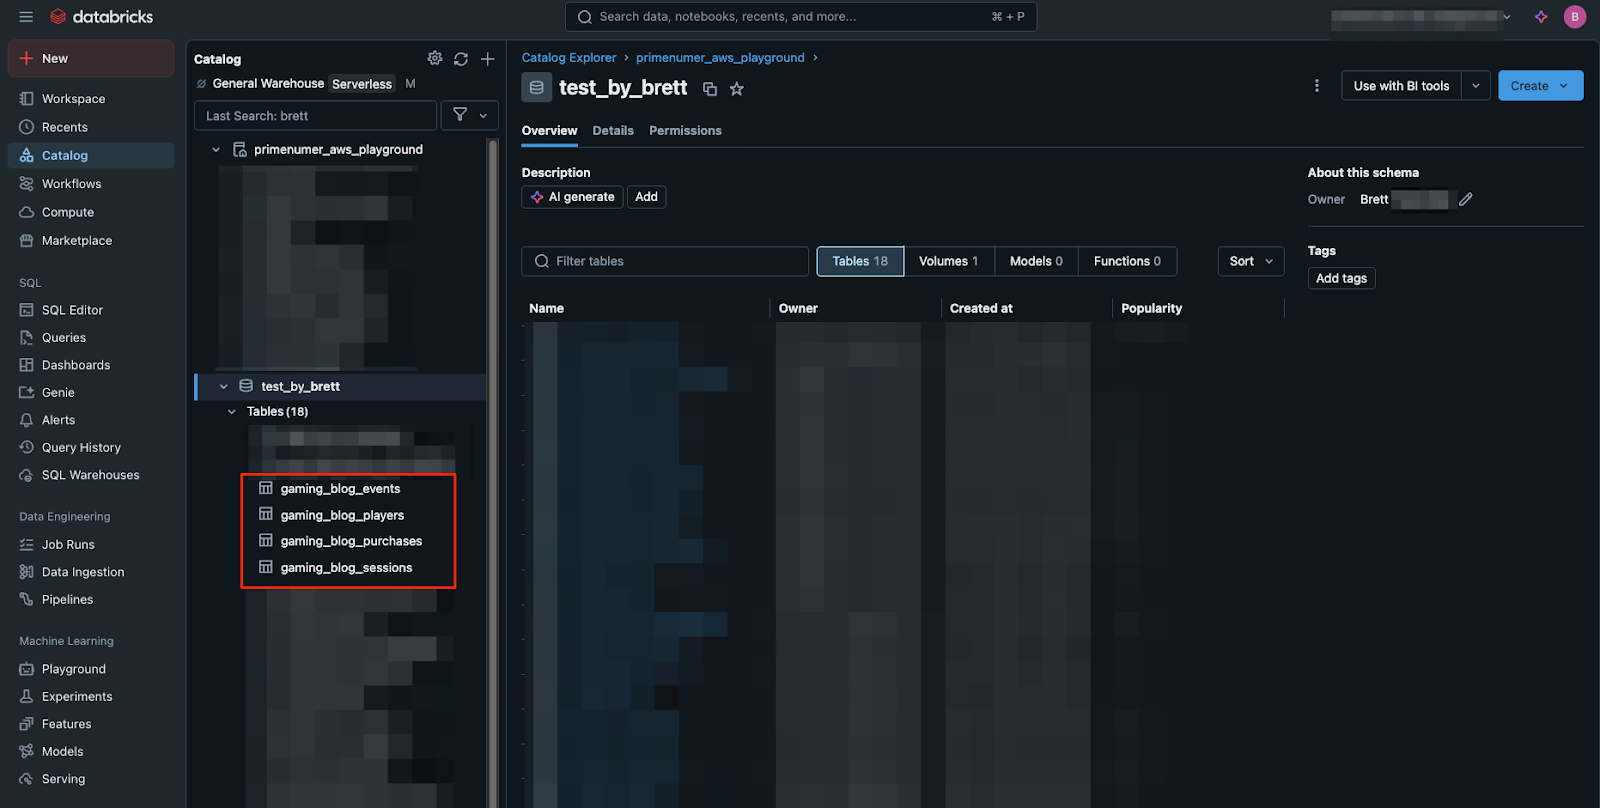
In this example we will extract the following 4 tables:
events
players
purchases
sessions
Once we’ve finished creating this configuration, we can add it to TROCCO’s Workflow feature.
After running the workflow, each of the tables will be extracted and loaded in parallel into Databricks Delta Lake. We can confirm that the tables have been loaded successfully in Unity Catalog, as shown below.
Now we’re ready to transform and aggregate the data for each of our use-cases.
Step 2: Transforming and Preparing the data for analysis
As our data is still in its raw form (also known as the bronze layer in the medallion architecture), the next step is to clean, transform, and combine it into a more usable format (silver or gold layer). There are several ways to approach this in Databricks, and in this example we will make use of Databricks Notebooks, to run our SQL queries.
From the side menu select Workspace → Create → and then Notebook.
Databricks notebooks are useful because they provide an interactive, collaborative environment for writing and executing code in Python, SQL, Scala, or R. They allow us to combine code, visualizations, and documentation in a single place, making it easy to develop, test, and debug data workflows.
In our notebook, we can write and run separate SQL queries to build each data model, resulting in our final tables that we will use in our visualizations.
After running our Notebook, we can find our newly created tables in Unity Catalog.
Next, we can move on to building our visualizations.
Step 3: Building dashboards in Databricks
With our data models in place, the next step is to turn that data into insights by building interactive dashboards. While many companies traditionally rely on specialized BI tools like Tableau or Power BI, Databricks has recently introduced its own AI/BI dashboard solution—making it a surprisingly powerful and convenient option within the platform itself.
We can start building our visualizations by clicking Dashboards in the side menu, and then Create Dashboard.
After selecting the data to use in the dashboard, and make use of the build-in assistant which enables us to convert natural language to SQL and help us easily build visualizations.
After we’re happy with our dashboards, we can publish or embed them by selecting ‘Publish’ from the top-right corner.”
Step 4: Orchestrating the data pipeline.
Until now, each of our steps has been a one-off run. But in production, we want dashboards that stay up to date with the latest data. This is where orchestrating the entire process comes into play. As in all of the previous steps, there are many ways to achieve this, but both Databricks and TROCCO offer features that make it easy to set up scheduled data pipelines—ensuring the end user always sees the latest information. Using the Workflow feature, we can orchestrate a sequence to run our Notebook, and then refresh our Dashboard.
We also need a way to integrate our ETL job in TROCCO with Databricks. For this we have two options:
Add a Python script to the Databricks Workflow to trigger a job run in TROCCO, using the TROCCO API. We would set this to run before the task that runs the Notebook. Please note that if using this method would have to specify in our Python script to wait for the ETL job to complete, before moving to the next task and running the notebook.
Set an HTTP trigger in TROCCO’s Workflow feature to run the above Databricks Workflow.
In this scenario, option two is the simpler option, as it doesn’t require writing a Python script. Back in TROCCO we can add an HTTP trigger from the left side panel in the Edit Workflow page
After entering the required URL, and parameters, add a schedule to the TROCCO workflow to run at your desired frequency.
Conclusion
And there we have it. We’ve now set up an end-to-end data pipeline for player behavior analysis utilizing TROCCO and Databricks. While this blog focused on foundational analytics like retention, churn, and monetization, there are many advanced directions this data can support. For example, studios can use this data to train machine learning models for personalized recommendations, dynamically adjust in-game content based on player segments, or trigger real-time engagement workflows such as push notifications or reward delivery.
Both TROCCO and Databricks offer free trials, so if you’re interested in trying to build something yourself check out the following links.


.webp)
.webp)


